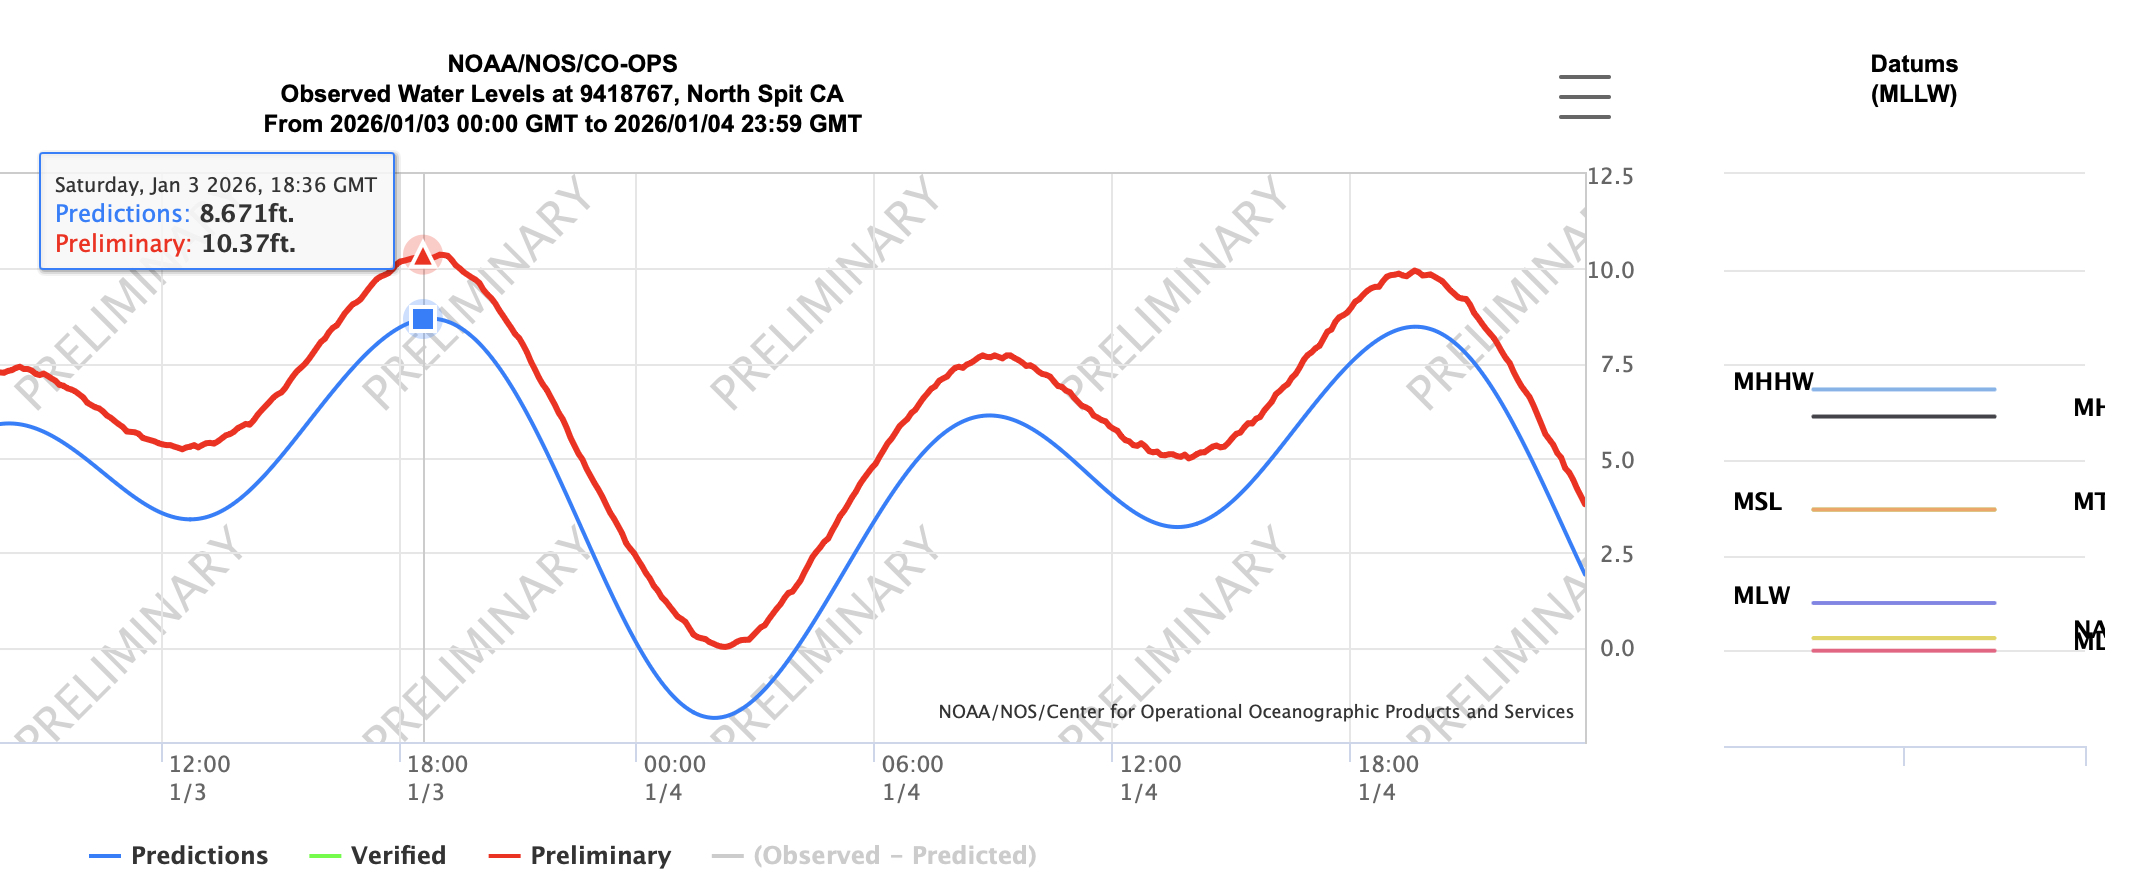
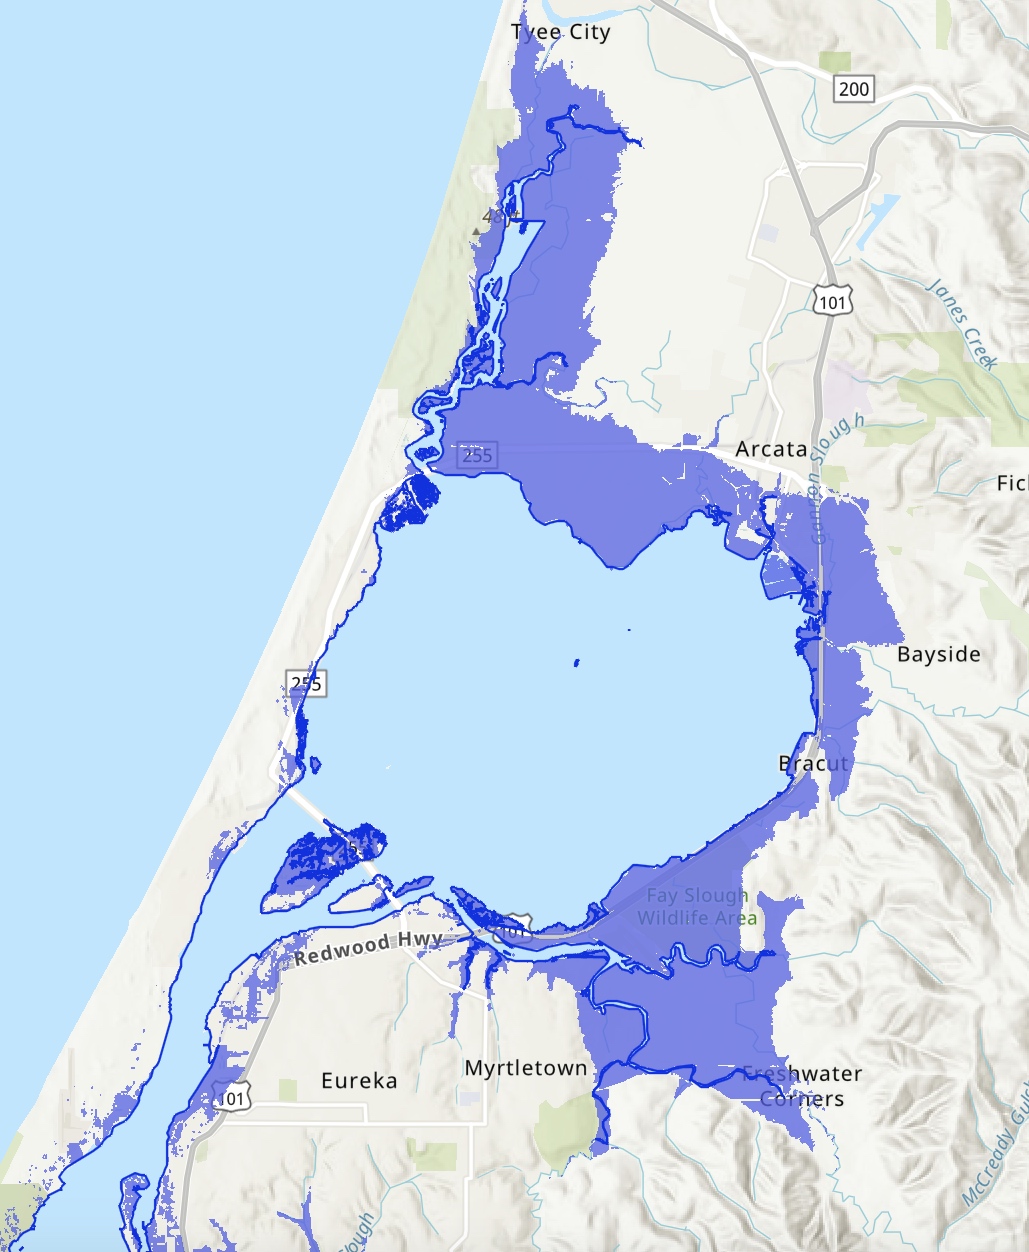
Has Saturday's highest King Tide on record gotten you wondering how our neighborhoods, roads, and open space will fare as sea level rises? Now you check out our interactive map of two sea level rise scenarios for the Humboldt Bay Area! Featured are scenarios showing 1- and 2-meters above Year 2000 water levels. For many years, these have been static maps with no simple way for the public to examine points of interest. Now, people wondering if their neighborhood is at risk can zoom in on locations and see street names, etc. King Tides are usually a time to consider how high a typical high tide will be with one foot of sea level rise, but this weekend's high tides were nearly three feet higher than the Mean Higher High Water at the North Spit. Note that this is the preliminary water level from the National Weather Service, which will verify that figure in a few weeks. If you are wondering what sea level rise scenarios are (as opposed to "projections"), or want to learn more about the science and data involved in making these maps, check out our new StoryMap, Understanding Sea Level Rise in the Humboldt Bay Area!This StoryMap was developed for Cal Poly Humboldt's Sea Level Rise Institute in coordination with Jeff Anderson of Northern Hydrology & Engineering, the folks who developed the local sea level rise scenarios for our region. It provides a summary of the science and compares NOAA's SLR scenarios to local scenarios, and features a slider tool that reveals how similar these two scenarios are.
 Has Saturday's highest King Tide on record gotten you wondering how our neighborhoods, roads, and open space will fare as sea level rises? Now you check out our interactive map of two sea level rise scenarios for the Humboldt Bay Area! Featured are scenarios showing 1- and 2-meters above Year 2000 water levels. For many years, these have been static maps with no simple way for the public to examine points of interest. Now, people wondering if their neighborhood is at risk can zoom in on locations and see street names, etc. King Tides are usually a time to consider how high a typical high tide will be with one foot of sea level rise, but this weekend's high tides were nearly three feet higher than the Mean Higher High Water at the North Spit. Note that this is the preliminary water level from the National Weather Service, which will verify that figure in a few weeks. If you are wondering what sea level rise scenarios are (as opposed to "projections"), or want to learn more about the science and data involved in making these maps, check out our new StoryMap, Understanding Sea Level Rise in the Humboldt Bay Area!This StoryMap was developed for Cal Poly Humboldt's Sea Level Rise Institute in coordination with Jeff Anderson of Northern Hydrology & Engineering, the folks who developed the local sea level rise scenarios for our region. It provides a summary of the science and compares NOAA's SLR scenarios to local scenarios, and features a slider tool that reveals how similar these two scenarios are.